US Adults 55+ are drinking more alcohol according to research

The percentages of 18 to 34-year-olds, who report that they either don’t drink, drank the past week, or sometimes drank more than they should, are all lower than they were 20 years ago, according to research conducted by American analytics company Gallup.

Yet, drinking on all three metrics has trended up among Americans 55 and over, while holding fairly steady among middle-aged adults.

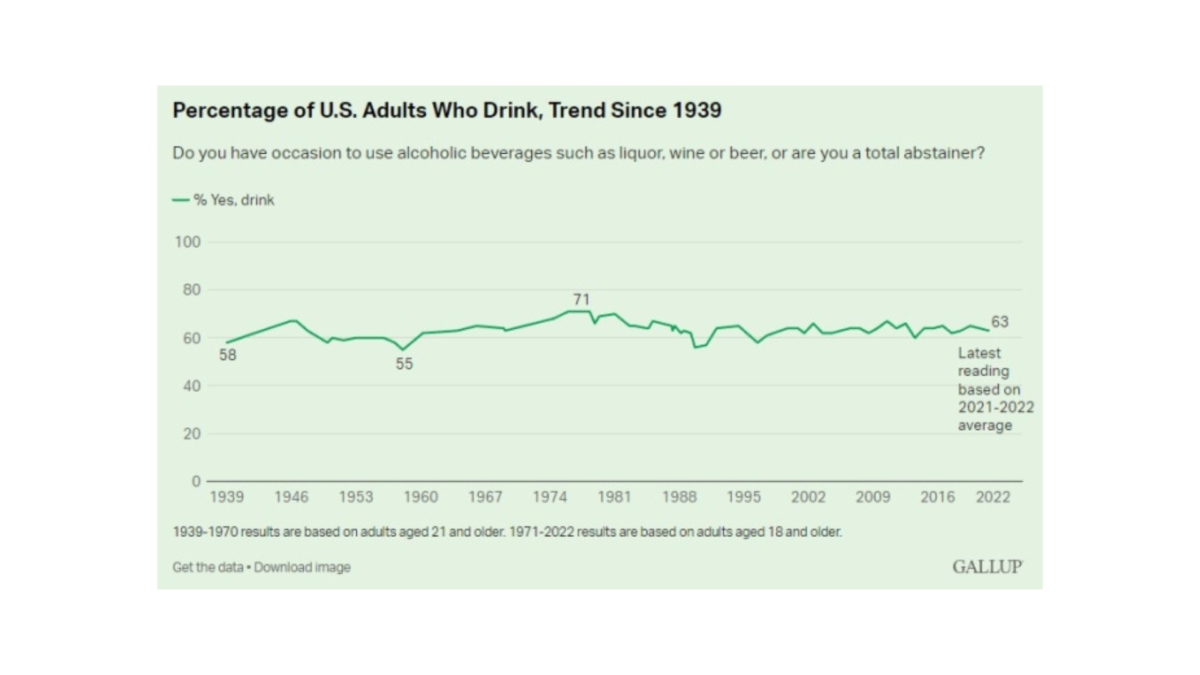
These results were based on an analysis of Gallup trends on Americans’ self-reports of their alcohol drinking habits. To allow for reliable analysis of the trends by age, the data was reviewed in three three-year time periods: 2001-2003, 2011-2013 and 2021-2023.

  • Adults under the age of 35, 62% reported that they drink alcohol, down from 72% two decades ago; and
  • Drinking has increased among adults aged 55 and older, from 49% to 59% in the same 20-year period.

This shows that drinking habits among younger adults may be on a downward trend, while the opposite can be said of people 55+. According to the research, there are still more drinkers under the age of 35 (62%) than in the 55 and over category (59%).

While these groups on either end of the age spectrum now report similar drinking rates, those in the middle, aged 35 to 54, maintain a higher drinking rate, at 69%, on par with the prior 67% readings for this age group.

The same trend can be seen among those classed as regular drinkers. Younger adults who drink are less likely than they were in the past to say they had an alcoholic drink within the past seven days, down from 67% to 61% over the last two decades. Older adults, aged 55 and over, have done the opposite, with figures rising from 63% to 69%.

Among all Americans (both drinkers and nondrinkers), fewer than four in 10 young adults (38%) now appear to be regular drinkers, on par with older adults (40%) with middle-aged adults (48%) more likely.

Research Results:  https://news.gallup.com/poll/509501/six-americans-drink-alcohol.aspx

New Report: What percentage of Americans drink alcohol?

Here is the short answer…

The percentage of US adults [18 years and older] who drink alcohol averaged 63% over the last two years, whereas 36% described themselves as “total abstainers.” The drinking rate ticks up to 65% when narrowed to adults of legal drinking age, which is 21 and older nationwide.

Since 1939, Gallup has asked Americans whether they “have occasion to use alcoholic beverages such as liquor, wine or beer” or if they are “a total abstainer.” Across the trend, the percentage saying they drink has dipped as low as 55% (in 1958) and risen as high as 71% (in the 1970s). However, in recent decades, the U.S. drinking rate has consistently registered near the long-term average of 63%.

Drinking Varies Most by Financial Means

The drinking rate among U.S. adults differs more by household income than by any other standard demographic characteristic. According to the 2021-2022 data, 80% of adults aged 18 and older living in households earning $100,000 or more say they drink, far exceeding the 49% of those earning less than $40,000. The rate among middle-income earners falls about halfway between, at 63%.

Relatedly, drinking also differs by education, with college graduates (76%) and postgraduates (75%) the most likely to report they drink. This is followed by nearly two-thirds of those with some college education (65%) and about half of those who haven’t attended college (51%).

Religiosity Also a Factor in Likelihood That People Drink

Whether people drink also varies significantly by their religiosity. Adults who attend their church or other place of worship weekly (50%) are less likely than less-frequent attenders (63%) and nonadherents (69%) to say they drink.

By contrast, religious denomination is not a strong factor in use of alcohol. Protestants are the least-likely major religious category in the U.S. to say they ever drink alcohol. However, the 60% of Protestants who in 2021-2022 reported they drink is only modestly lower than the 68% among U.S. Catholics and 67% among those with no religious affiliation.

Men, Younger and White Adults More Likely to Drink Than Their Counterparts

In contrast to the wide variations seen by income and religiosity, alcohol consumption varies only slightly by gender, with 66% of men versus 61% of women saying they ever have occasion to drink.

Drinking is more common among younger than older adults, but this is evident only when the analysis is limited to those of legal drinking age. Whereas 60% of adults aged 18 to 29 say they drink, the rate is 71% among those aged 21 to 29. That matches the percentage of 30- to 49-year-olds who drink (70%), while it exceeds the rate among those 50 to 64 (64%) and 65 and older (54%).

Among the nation’s largest racial and ethnic groups, White adults aged 18 and older (68%) are more likely than Hispanic adults (59%) or Black adults (50%) to report they drink. A review of Gallup’s longer-term data confirm that White adults have been consistently more likely than Hispanic and Black adults to drink, while the rate among the last two groups has been statistically similar.

How Much Do Drinkers Consume?

Overall, U.S. drinkers reported consuming a modest amount of alcohol in 2022, averaging four drinks per week for all drinkers. The figure rises to six drinks per week on average for those who appear to be regular drinkers, defined as those who had at least one drink in the past week.

More specifically, when asked how many alcoholic drinks of any kind they had in the past seven days, a third of drinkers (34%) in 2022 said they had had none. About half (53%) said they had between one and seven drinks, while 12% reported consuming eight or more drinks, thus averaging more than one per day.

What Is Americans’ Drink of Choice?

For many years, beer was the strong favorite of U.S. drinkers, mentioned by close to half as the alcoholic beverage they most often drink. It still leads, but by a thinner, four-percentage-point margin over wine, 35% to 31%, according to the 2022 survey. Meanwhile, 30% favor liquor — a new high — and 3% have no preference.

Source:  Gallup

#wine #winelovers #uswinelovers #winenews #wineeconomics #winestats #winefacts #alcohol #gallup #usnews #winestatistics #winconsumption #winetrends