The Petaluma Gap Wine Growers Alliance (PGWA) has been working with an illustrator to develop a more intricate digital and printable AVA map. While this project in progress, the Alliance wanted something temporary on the website and quickly created a custom and free AVA map using Google My Maps.
Here are the steps to follow in creating a map of a particular AVA:
Step 1 – Create A New Map – Access the Google My Maps website and sign in with your Google account. You’ll need to create an account if you don’t have one yet. Once logged in, click the “+ Create a new map” button to initiate the map-building process.
Step 2 – Personalize Your Map – At the top left corner of the page, locate the “Untitled map” field. You can enter your organization’s name.
Step 3- Define Your Boundary – Download an SHP (shape) of your AVA boundary as defined by the federal government from the TTB website. Since Google Maps only supports KML files, you must convert the SHP using geographical information software (GIS). For instance, we used the open-source GIS application QGIS for this purpose. Import the converted KML file into Google Maps as your initial layer.
Step 4 – Map Wineries – Create an additional layer for wineries. Utilize the search function to locate wineries by name or address. Click the “Add to map” option in the toolbar. If a winery has claimed its business on Google, relevant information will appear in the drop-down menu. Choose or customize the marker icon, such as a wine glass or grape icon.
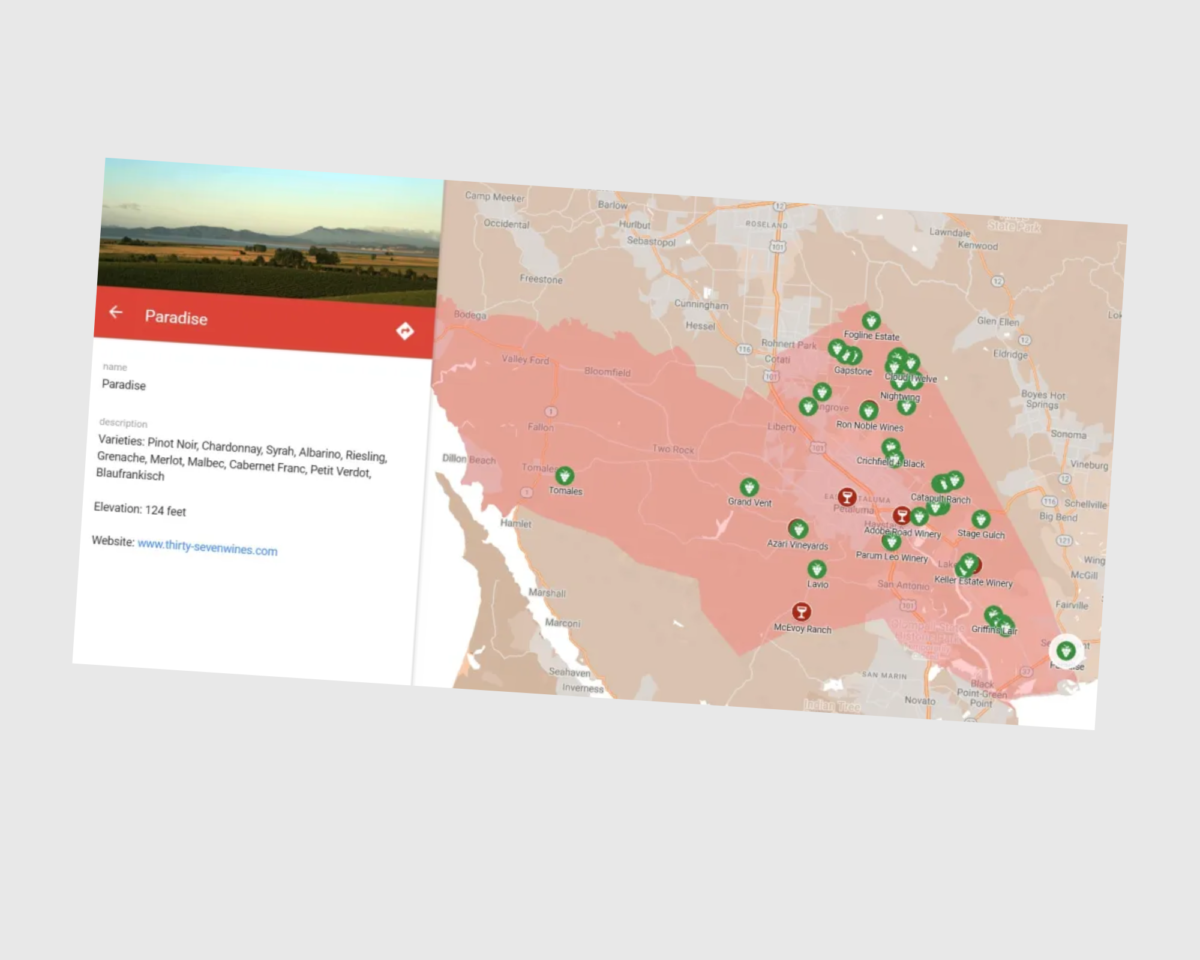
Step 5 – Plot the Vineyards – PGWA has employed latitude and longitude coordinates to locate vineyards. Since only a few vineyards were registered as businesses on Google, they manually inputted information, including vineyard photos, a list of cultivated grape varieties, and elevations. Non-grower members were identified on the map with less detailed information.
Step 6- Organize Your Layers – You can enhance your map by creating multiple layers. This helps in segregating distinct categories of data. Click the “Add layer” button in the left sidebar to establish a new layer. In our case, separate layers were used for wineries, vineyards, and members and non-members.
Step 7 – Share Your Map – The map can be shared using a unique link, making it accessible to specific individuals or made public or private. Most importantly, you can embed code to easily incorporate the map into your website or blog.
This serves as a valuable tool for wine organizations and wine professionals in showcasing vineyards and tasting rooms within the geographical boundaries.
Source: Wine Data Researcher