Silicon Valley Bank Releases 23rd Annual State of the US Wine Industry Report

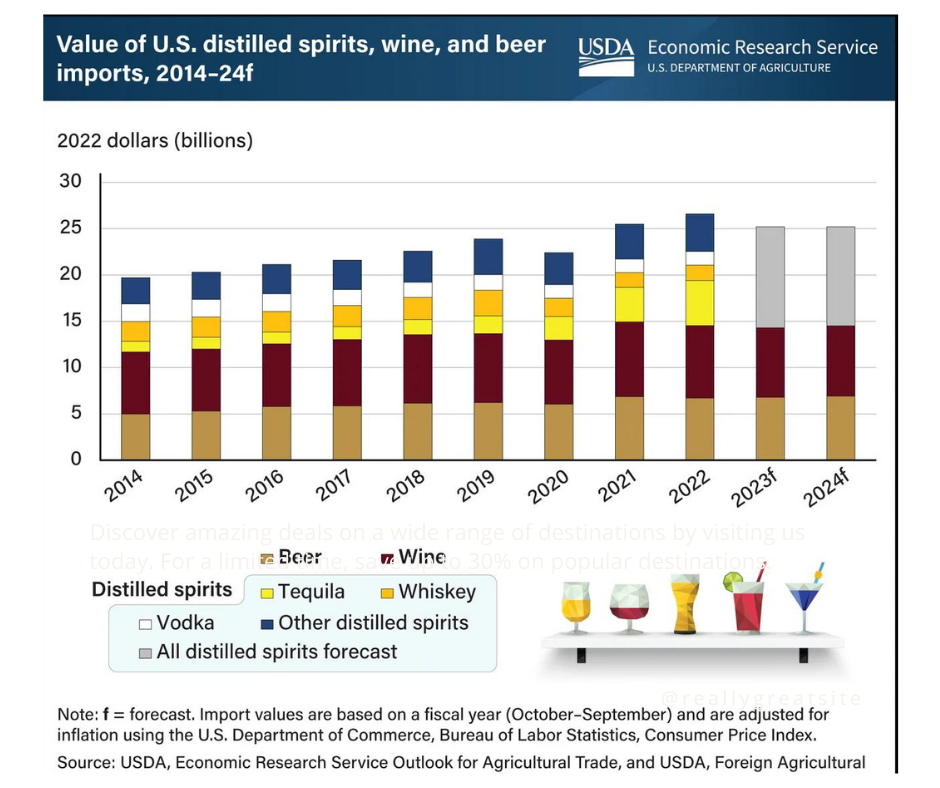
The 2024 report examines the latest consumption, pricing, sales data, and the most promising wine industry marketing strategies. It provides an in-depth analysis on the key trends impacting the US wine industry:

• While full-category wine sales by volume will be down for a third consecutive year;
• 2023 year-end premium wine sales will likely end with another year of positive value growth;
• Tasting room visitation was lower in the premium segment in 2023, but improvement is expected in 2024;
• Direct-to-consumer sales will grow again modestly in 2024; and
• Conditions for overproduction in the total wine category are present, but inventory supply is more balanced in the premium segment.

Full Report: https://shorturl.at/xHXY9

2022 Data for U.S. Alcohol Imports

The United States imported $26.6 billion in alcoholic beverages in 2022.

Total U.S. imports of distilled spirits, beer, and wine accounted for 14 % of all U.S. agricultural imports.

Distilled spirits were the largest and fastest-growing segment of these products, accounting for almost half or $12 billion of U.S. alcohol imports.

Source: USDA Economic Research Service

PGWA Creates Custom AVA Wine Maps Using Google Maps

The Petaluma Gap Wine Growers Alliance (PGWA) has been working with an illustrator to develop a more intricate digital and printable AVA map. While this project in progress, the Alliance wanted something temporary on the website and quickly created a custom and free AVA map using Google My Maps.

Here are the steps to follow in creating a map of a particular AVA:

Step 1 – Create A New Map – Access the Google My Maps website and sign in with your Google account. You’ll need to create an account if you don’t have one yet.  Once logged in, click the “+ Create a new map” button to initiate the map-building process.

Step 2 – Personalize Your Map – At the top left corner of the page, locate the “Untitled map” field. You can enter your organization’s name.

Step 3- Define Your Boundary – Download an SHP (shape) of your AVA boundary as defined by the federal government from the TTB website. Since Google Maps only supports KML files, you must convert the SHP using geographical information software (GIS). For instance, we used the open-source GIS application QGIS for this purpose. Import the converted KML file into Google Maps as your initial layer.

Step 4 – Map Wineries – Create an additional layer for wineries. Utilize the search function to locate wineries by name or address. Click the “Add to map” option in the toolbar. If a winery has claimed its business on Google, relevant information will appear in the drop-down menu. Choose or customize the marker icon, such as a wine glass or grape icon.

Step 5 – Plot the Vineyards – PGWA has employed latitude and longitude coordinates to locate vineyards. Since only a few vineyards were registered as businesses on Google, they manually inputted information, including vineyard photos, a list of cultivated grape varieties, and elevations. Non-grower members were identified on the map with less detailed information.

Step 6- Organize Your Layers – You can enhance your map by creating multiple layers. This helps in segregating distinct categories of data. Click the “Add layer” button in the left sidebar to establish a new layer. In our case, separate layers were used for wineries, vineyards, and members and non-members.

Step 7 – Share Your Map – The map can be shared using a unique link, making it accessible to specific individuals or made public or private.  Most importantly, you can embed code to easily incorporate the map into your website or blog.

This serves as a valuable tool for wine organizations and wine professionals in showcasing vineyards and tasting rooms within the geographical boundaries.

Source:  Wine Data Researcher

US [on-premise] Wine Sales Total $14.8 Billion

Wine sales in the US on-premise sector totaled $14.8 billion in the 52 weeks ended October 8, 2022 according to CGA Strategy by NielsenIQ.

Latest data from the market research firm CGA Strategy reflects a 22% increase over the same period in 2021, but growth is slowing as the on-premise market recovery continues.

Sparkling wine continues to stand out with sales up 34% in the recent period to $2.6 billion. Total domestic wine sales came to $9.2 billion, up 20%, while imports totaled $5.5 billion. Sales of white wine came to $7.2 billion followed by red at $6.5 billion. Happy to say that rosé sales grew 27% to $904 million.

The growth comes in a competitive market marked by fewer outlets and fewer choices for drinkers. CGA reports the number of fine dining outlets has decreased 4.1% between October 2021 to October 2022, while consumer surveys found 21 % of diners report they have noticed fewer menu items and 40 % of those say there are fewer wine options.

In a webinar last week, Andrew Hummel, CGA client Solutions Director for North America, said surveys of on-premise consumers consistently find 50% report they drink something different at restaurants and bars than what they enjoy at home. “It’s really important to understand the on-premise consumer and segment them differently from the off-premise consumer,” he further states.

In terms of the different types of on-premise wine consumers, 37% of those surveyed by CGA who are wine drinkers fall into the company’s “curious and on a budget” category which represents about 30% of all consumers. These restaurant and bar patrons are “moderately engaged,” typically visiting in the early evening and enjoying trying new drinks yet are price sensitive and attracted to values.

To help wine producers navigate a changing market, CGA developed a new report that offers a “360-degree view” of wine in the on-premise sector. This new report blends market data with consumer surveys and “user” data as well as a channel strategy analysis into what the firm describes as its most comprehensive analysis of the on-premise market for wine. “Whether teams are considering a new brand launch in the market or managing a portfolio of legacy wines, the report will provide a robust set of insights across relevant topics to help drinks suppliers win in the on-premise,” states Matthew Compton, CGA’s regional director of North America.

Sources:
NielsenIQ
Wines Vines Analytics

#wine #whitewine #winenews #winelovers #redwine #rosewine #sparklingwine #champagne #USAwinemarket #wineeconomics #winetrends #winemarketing #winesales #winebusiness

September is “California Wine Month” – here’s how you can celebrate!

September is “California Wine Month” this is the time to celebrate the annual harvest and raise a glass to their vibrant wine community.

California’s wine industry has played a vital role in the state’s culture and economy for over 250 years. California makes up 81% of wine production in the United States and 95% of exports. Within the state’s 147 distinct winegrowing regions are 621,000 acres of vineyards, 4,800 bonded wineries and nearly 6,000 winegrowers.

Here are three exciting ways to celebrate California Wine Month

  1. Participate in Events and Experiences at California Wineries

Over 24 million people from around the globe visit the California winegrowing regions each year.  Visit wineries across the state 40+ harvest-themed events, activities and experiences — and more will continue to be added throughout September. These include behind-the-scenes vineyard and crush pad tours, grape-stomping competitions, wine and food festivals, hands-on harvest experiences, charity wine auctions and more.

“California’s diverse and expansive wine country is one of its top tourism draws,” said Caroline Beteta, Visit California president and CEO. “From high-end pairings and legendary wineries to sustainable vineyards and neighborly barn tastings, there’s an experience — and a wine — for everyone to enjoy.”

  1. Pair Iconic California Recipes with California Wine

It’s no coincidence that California wine pairs perfectly with the state’s farm-fresh produce and trend-setting cuisine. To help consumers experience this delicious culinary connection at home, Discover California Wines has partnered with California Grown and Visit California to create the free “Iconic California Dishes to Celebrate California Wine Month” e-book. The book features recipes for dishes that evoke the state’s sunny and relaxed vibe — all paired with California wine and creative, wine-based cocktails. Bring harvest home with recipes including Avocado Salad with Hidden Valley Ranch-Style Dressing, Wine Country Chicken Salad and the California 75, a classic wine-based lemon cocktail with a literal and figurative twist.

“We say what grows together goes together,” said Cher Watte Angulo, executive director of California Grown. “Since California provides over 50% of the nation’s produce and over 80% of the wine, it makes sense that people celebrate with both a sip and a bite of the Golden State.”

  1. Discover and Enjoy California Wine

Whether visiting wineries in person or online, there’s no better time than California Wine Month to pick up a few bottles of wine to share with friends and family. It’s also easy to find a great selection of California wine at your local grocery store or wine shop.

For the latest details on offerings, visit the Discover California Wines website.

#californiawinemonth #californiawines #harvest #winecountry #napavalley #winelovers #winetourism #winenews #wine @cagrownofficial @napavintners @sonomavalleywine @sierravintners @temeculawines @pasowine @maderawinetrail @winesofscm @mendowine @livermorevalleywinecountry @santabarbarawinecountry @lodi_wine